If you read this blog regularly, you'll know I'm interested in the concept of the Draw Rate, a figure seldom used in college admissions. Many people, when thinking about market position in higher education use selectivity or admit rate (the percentage of applicants admitted), or yield rate (the percentage of students offered admission who enroll) by themselves.
But in the market of higher education, these two variables often fight against each other. (BTW, if you object to the use of the word "market" in higher education because you think it debases our profession, see what Zemsky, Wegner, and Massy have to say about that here.)
Colleges, driven by market expectations, have for a long time tried to increase applications, believing that what the market wants is greater selectivity in the institution they choose, based on the Groucho Marx effect. Except that in order to enroll the class you want, you have to take more students when apps go up (at least in the case of the bottom 90% of colleges). That's because your incremental applications almost certainly have a lower propensity to enroll.
So, Draw Rate (yield rate/admit rate) helps account for that. Higher Draw Rates are generally a sign of higher market position. Think about it mathematically: A very high numerator (high yield) coupled with a very low denominator (low admit rate) is the thing many colleges pursue. If you pursue greater selectivity and don't account for the lower yield, you won't be in enrollment management too long.
The problem, of course, is that, in general, people who were not born 18 years ago don't apply to college. And the number of people who will turn 18 in any given year continues to drop going forward. So no matter how many applications each student makes, they can only go to one college next fall.
Over the past several years, the "Winner Take All" mentality has driven demand at the most selective institutions. The need to keep up trickles down to each tier below, and the annual "We received a record number of applications for this freshman class" shtick gets old fast, even if colleges have not gotten that message yet.
The take away: Colleges have been spinning their wheels, working harder and harder to generate more applications just to stay even. The national psychosis weighs heavily on the minds of parents and students, and they respond by hedging their bets, applying to--guess what--more colleges. And the spiral spirals out of control.
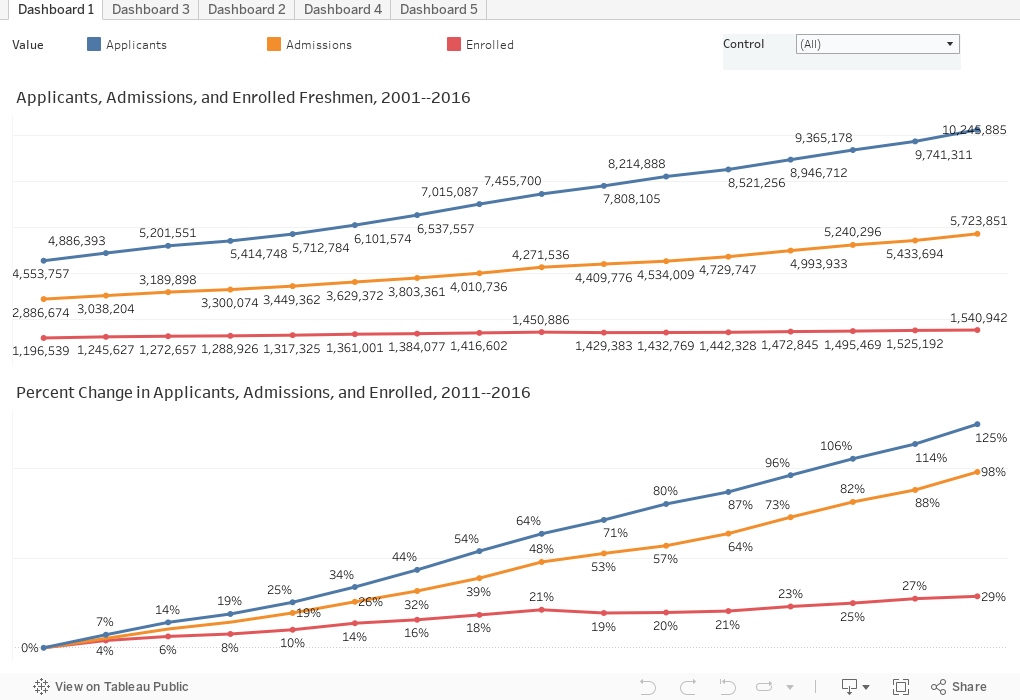
Here are five views (using tabs across the top) to show the data.
Dashboard 1 is a high level overview of applications, admits, and enrolls at four-year public, and four-year, not-for-profit institutions (open admission institutions do not report application activity to IPEDS). You can use the control at top to show all institutions, or just public or private. Top view is raw numbers; bottom is percent change.
Dashboard 3, the next tab, shows the same data on bar charts, with the draw rate as a brown line hovering over the bars. Note how it's dropped over time: This is the effect of soft applications. You can look at any region, or any single institution if you want, but the really interesting filter is at top right: Compare colleges by their 2016 selectivity. You see that the only institutions who have collectively increased their draw rates are exactly the ones who had the strongest market position already: The most selective colleges. Step down from Most to Highly to Very, etc, and watch the trend on the brown line.
Next comes Dashboard 2, showing Applications per Seat in the Freshman Class, and draw rate by region. This might explain why we in the Midwest are fascinated with the obsession with college admissions by East and West Coast media. Y'all are welcome to come to the Midwest and chill, if you'd like. You can use the filter to select groups of colleges by Carnegie type.
Dashboard 4 shows four key metrics to reinforce the relationship between and among them. Again, select by 2016 Selectivity to see how they make a difference.
Finally, Dashboard 5 allows you to compare individual institutions. I've put Harvard, Stanford, and MIT on to start, but you can choose any colleges you wish. (I recommend no more than three or four at a time.) To remove a college, hover over its name in the filter and X it out. To add, type any part of the name and hit "Enter" on your keyboard. You'll be presented with all possible matches, and just choose the ones you want. I recommend choosing similar institutions for scaling/charting purposes.
I hope this is interesting to you; let me know what you see, and if you spot any problems.
But in the market of higher education, these two variables often fight against each other. (BTW, if you object to the use of the word "market" in higher education because you think it debases our profession, see what Zemsky, Wegner, and Massy have to say about that here.)
Colleges, driven by market expectations, have for a long time tried to increase applications, believing that what the market wants is greater selectivity in the institution they choose, based on the Groucho Marx effect. Except that in order to enroll the class you want, you have to take more students when apps go up (at least in the case of the bottom 90% of colleges). That's because your incremental applications almost certainly have a lower propensity to enroll.
So, Draw Rate (yield rate/admit rate) helps account for that. Higher Draw Rates are generally a sign of higher market position. Think about it mathematically: A very high numerator (high yield) coupled with a very low denominator (low admit rate) is the thing many colleges pursue. If you pursue greater selectivity and don't account for the lower yield, you won't be in enrollment management too long.
The problem, of course, is that, in general, people who were not born 18 years ago don't apply to college. And the number of people who will turn 18 in any given year continues to drop going forward. So no matter how many applications each student makes, they can only go to one college next fall.
Over the past several years, the "Winner Take All" mentality has driven demand at the most selective institutions. The need to keep up trickles down to each tier below, and the annual "We received a record number of applications for this freshman class" shtick gets old fast, even if colleges have not gotten that message yet.
The take away: Colleges have been spinning their wheels, working harder and harder to generate more applications just to stay even. The national psychosis weighs heavily on the minds of parents and students, and they respond by hedging their bets, applying to--guess what--more colleges. And the spiral spirals out of control.
Here are five views (using tabs across the top) to show the data.
Dashboard 1 is a high level overview of applications, admits, and enrolls at four-year public, and four-year, not-for-profit institutions (open admission institutions do not report application activity to IPEDS). You can use the control at top to show all institutions, or just public or private. Top view is raw numbers; bottom is percent change.
Dashboard 3, the next tab, shows the same data on bar charts, with the draw rate as a brown line hovering over the bars. Note how it's dropped over time: This is the effect of soft applications. You can look at any region, or any single institution if you want, but the really interesting filter is at top right: Compare colleges by their 2016 selectivity. You see that the only institutions who have collectively increased their draw rates are exactly the ones who had the strongest market position already: The most selective colleges. Step down from Most to Highly to Very, etc, and watch the trend on the brown line.
Next comes Dashboard 2, showing Applications per Seat in the Freshman Class, and draw rate by region. This might explain why we in the Midwest are fascinated with the obsession with college admissions by East and West Coast media. Y'all are welcome to come to the Midwest and chill, if you'd like. You can use the filter to select groups of colleges by Carnegie type.
Dashboard 4 shows four key metrics to reinforce the relationship between and among them. Again, select by 2016 Selectivity to see how they make a difference.
Finally, Dashboard 5 allows you to compare individual institutions. I've put Harvard, Stanford, and MIT on to start, but you can choose any colleges you wish. (I recommend no more than three or four at a time.) To remove a college, hover over its name in the filter and X it out. To add, type any part of the name and hit "Enter" on your keyboard. You'll be presented with all possible matches, and just choose the ones you want. I recommend choosing similar institutions for scaling/charting purposes.
I hope this is interesting to you; let me know what you see, and if you spot any problems.
Comments
Post a Comment